A marketing machine that books jobs while you’re in the attic. Built in 7 days. $497 to start. You own it.
Anyone can sell you a website. Wrench Grid installs a revenue system behind it: a smart estimator that pre-qualifies homeowners, automation that nurtures every lead, follow-up that chases every unsold estimate, and a booking calendar that fills your schedule at 9pm on a Sunday. The website is just the face. We call the machine underneath The Grid — and it puts money in your pocket.
See how much revenue could be slipping away.
Run your real numbers. No credit card — see the estimate first.
Free estimate — no credit card.
Analyzing your website opportunity
Revenue likely slipping away
Those jobs are likely going somewhere — often to the HVAC company that is easier to find, trust, and contact.
Built around the HVAC brands homeowners already know
3 systems. One growth path for HVAC companies.
This is not a brochure site — it is a pipeline. Diagnose your revenue leaks with the AI Report, install the LeadGrid machine that captures, nurtures, and books jobs around the clock, then add dispatch automation as the trucks multiply.
AI Revenue Leak Report
Shows HVAC owners where missed follow-up, weak reviews, and operational gaps may be costing them money.
Run free reportHVAC LeadGrid
A done-for-you website, lead capture, follow-up, missed-call recovery, and Google review automation product.
Get my websiteAuto Dispatch Command
AI-assisted dispatch workflows to route requests, reduce delays, and keep jobs moving.
Join dispatch waitlistA professional HVAC website, built right, for less than agency prices.
Wrench Grid builds HVAC websites three ways: Owned at $1,497 total — you own everything. Managed at $97/mo — we host, secure, update, and support the site for you. Growth at $197/mo — everything in Managed plus Google Business Profile support, review automation, and quarterly content refreshes. All three start with a $497 deposit, refundable at first design review.
The difference between being online and having a system that works.
Most HVAC owners do not just need a page on the internet. They need a professional online presence that earns trust, captures demand, follows up fast, and turns more searches into real conversations.
No website
- Homeowners struggle to find or trust you online.
- No after-hours form collecting job requests.
- No central place to show reviews, services, financing, or maintenance plans.
- Every missed call can become a competitor’s job.
Agency website ($5K–$15K)
- Looks professional, but priced for $5M+ businesses.
- Long discovery calls, 14-page proposals, 6–8 week builds.
- Often locks you into proprietary platforms or domain.
- Generic templates rebranded for every trade.
Wrench Grid
- Built for HVAC specifically — not generic trades.
- $497 to start. Three plans: Owned, Managed, or Growth.
- Delivered in 7 days. No discovery calls, no scope creep.
- You own your domain, content, and leads — always.
- Satisfaction guarantee on your deposit.
A simple path from invisible online to a professional HVAC website.
HVAC owners do not want another complicated marketing project. They want a clear path, fast setup, and a website that earns trust the moment a homeowner lands on it.
Pick your plan and pay your deposit.
Choose Owned ($1,497 total), Managed ($97/mo), or Growth ($197/mo). $497 deposit gets us started — refundable at first design review.
We build your site in 7 days.
Wrench Grid builds your HVAC website around emergency calls, service requests, trust signals, and local conversion. Two rounds of revisions included.
Launch and own it.
You approve. We launch. You own your domain, your content, your leads. Owned clients get final files; Managed and Growth clients get ongoing hosting, support, and updates.
See the kind of HVAC website that can turn visitors into booked calls.
Open any demo below to see how your HVAC company could present services, build trust, capture estimate requests, show project proof, and turn more homeowners into booked calls.
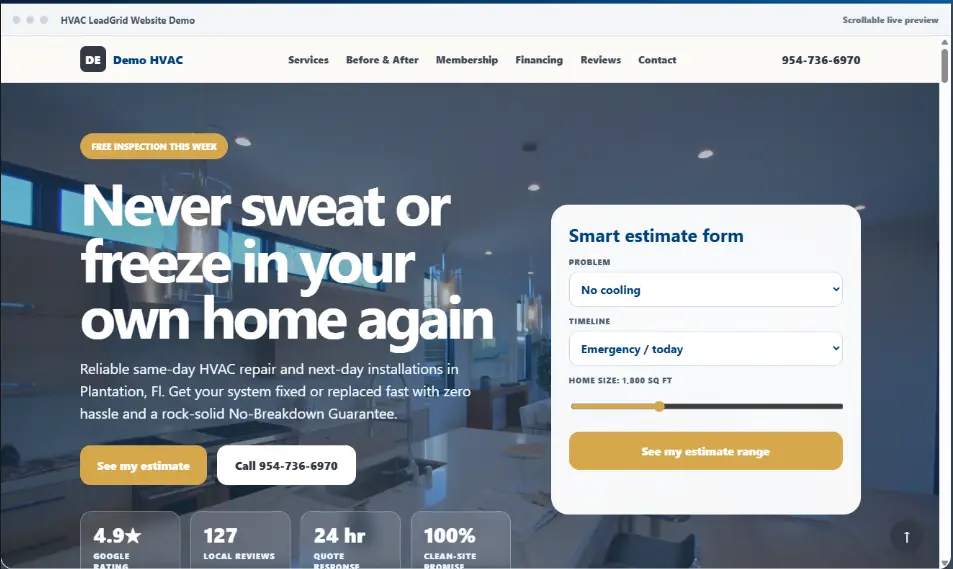
HVAC LeadGrid Demo
A complete HVAC site with hero CTA, estimate form, trust proof, service sections, and booking paths.
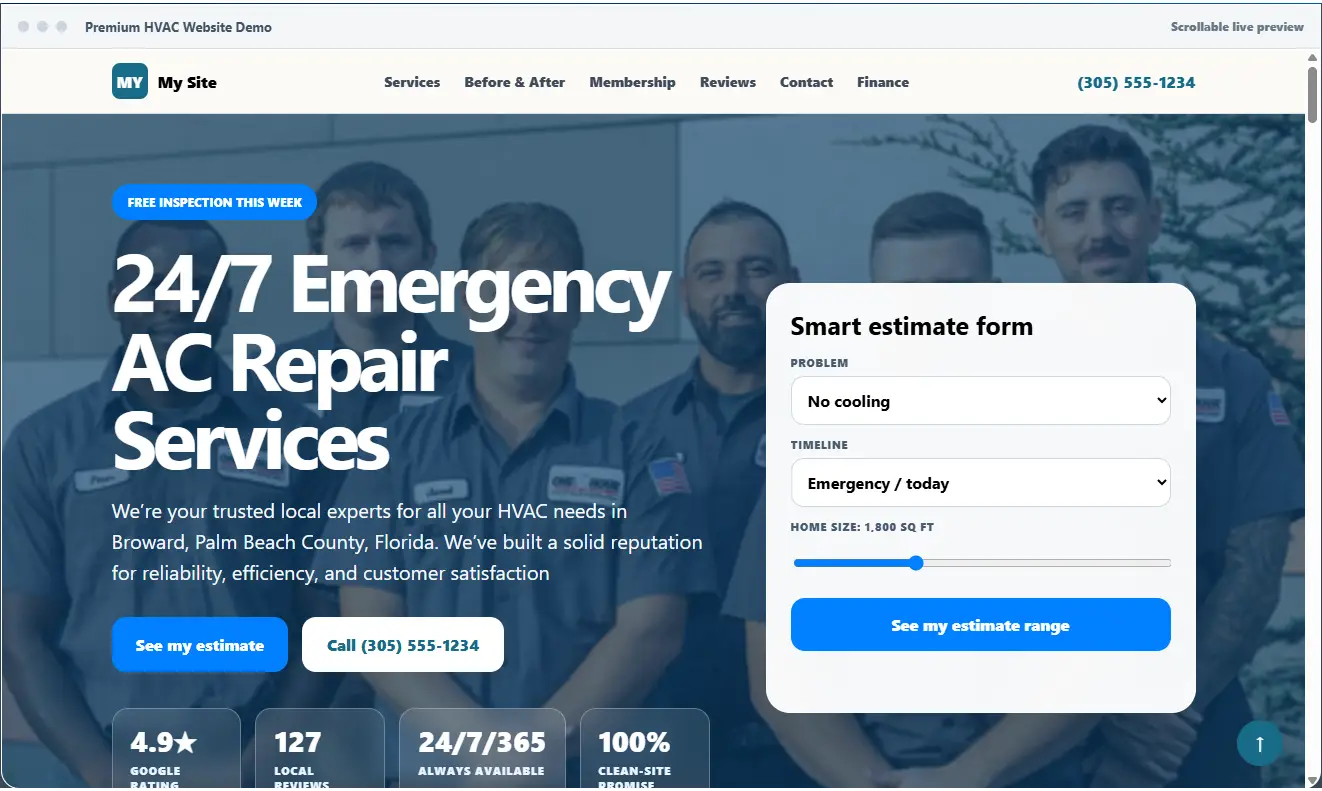
Premium HVAC Demo
A second demo option with a clean modern layout, strong service positioning, and conversion-ready sections.
Project Proof Layout
A visual proof section designed to show installs, upgrades, financing options, and homeowner confidence — now featuring the live Energy Savings Estimator and Replace-or-Repair Calculator.
Built for HVAC. Priced for the small operator.
Wrench Grid is structured so you can see the demo, pick a plan, and move forward without the discovery-call gauntlet most agencies put you through.
If you keep saying “I’ll build the website later,” this was made for you.
HVAC LeadGrid is built for owner-led shops that need a professional online presence, lead capture, follow-up, and review automation before they are ready for expensive enterprise software.
- Owners running on referrals and word-of-mouth
- 1–10 tech shops that need the operating layer, not enterprise software
- Shops still answering every call manually
- Companies that need reviews, forms, and follow-up handled automatically
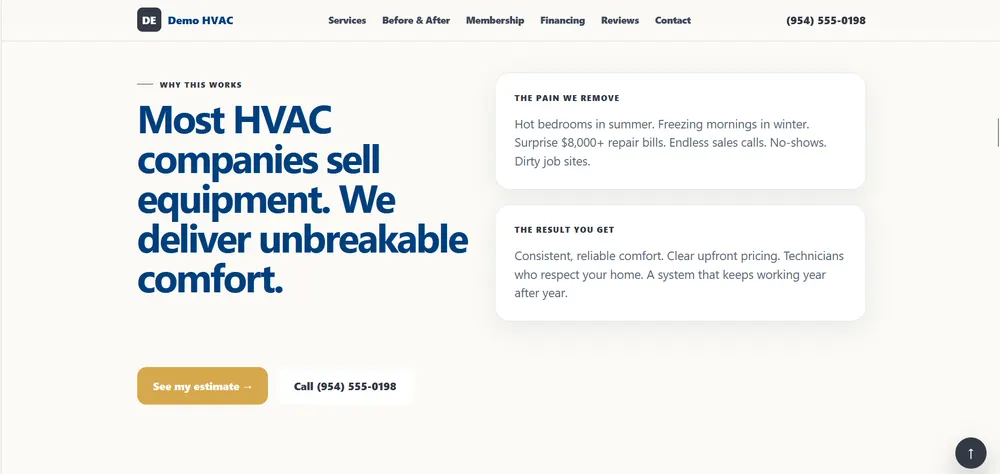
For shops that are good at the work — but invisible online.
You may already have word-of-mouth, repeat customers, and solid technicians. But if homeowners cannot quickly find, trust, and contact you online, the next call may go to a competitor.
Homeowners judge your company before they ever call.
A clean wrapped truck earns trust in the driveway. Your website has to earn that same trust online — because that’s where homeowners check you out first. Wrench Grid makes the online half of your brand look as sharp as the rig parked out front.
Get My WebsiteThe Grid, caught working. Real product · demo data
The Grid is the revenue system running behind every site we build. No stock photos, no mockups — these are actual screenshots of it working. This is what your homeowners, your techs, and your bank account see.
The homeowner gets a real number in 60 seconds.
The Smart Estimator asks the right questions — problem, timeline, home size — and hands you a pre-qualified lead with full contact details. No more vague “call me” messages.

Instant estimate range — then they book their own job.
The visitor sees a realistic price range on the spot, picks an arrival window, and lands on your calendar — often before a competitor has even returned their call.

Branded emails that chase the money for you.
Every estimate is delivered instantly in a professional email with the price locked in and one-tap Call and Book Online buttons — then automatic follow-ups at day 2, 7, and 21 until the job is won.

Road Mode: no logins, no portal, no tech headache.
One private link on the tech’s phone. Log a quote in 20 seconds between jobs, tap Won the moment the customer says yes — the emails stop and the revenue is booked.

A leaderboard your techs will actually fight over.
Points for every estimate logged, every job won, every dollar recovered. Guys are competitive — put cash on the monthly winner and watch follow-up stop being a chore.

And the dashboard that counts every dollar your follow-ups rescued.
Revenue recovered, open pipeline, jobs won after follow-up, and the team scoreboard — one screen that tells you exactly what The Grid earned this month. This number is why owners never cancel.

Automatic dispatch. The wasted slot in every tech’s day, filled automatically.
The third piece of the Wrench Grid stack is an AI-assisted dispatch layer designed to route the next call into the right tech’s day before the owner even sees the gap. Most 1–10 tech HVAC shops bleed margin from one wasted slot per day. Dispatch routes around it by skill, location, and slot availability — then pushes the assignment to the right phone.
- Smart routing by skill, location, and availability
- Auto-batching for service areas
- Owner-phone alerts instead of another dashboard
- Connects directly to the 24/7 lead pipeline
Lock in founder pricing.
Join now and your rate is locked when dispatch launches.
No spam · No credit card · Founder pricing locked when you join.
See what a better HVAC website could be worth before you book a call.
Use your real service-area numbers below. We’ll calculate the monthly and yearly opportunity first — then you can decide if you want Wrench Grid to build your HVAC website.
Calculate your HVAC website opportunity.
This estimates how much revenue may be going to competitors when homeowners cannot quickly find, trust, and contact your business online.
See the estimate first, then choose the next step.
Enter your average job value, missed leads, and close rate on the left, then press Calculate My Website Opportunity to run your numbers.
Calculating your opportunity
Three ways to get your HVAC website. Pick what fits your business.
$497 deposit gets us started. Choose a one-time website build or a managed plan with hosting, support, and updates after launch.
$497 down · $1,000 net-30 from launch
- Professional 6-page HVAC website
- Mobile-responsive, fast-loading
- Click-to-call buttons and lead capture form
- Smart Estimator Form — pre-qualified leads, not “call me” messages
- Basic local SEO setup (title tags, meta, schema)
- Google Business Profile setup help
- 2 rounds of revisions included
- 30 days of post-launch support
- Final files handed over — you own everything
- Optional hosting available at $29/mo
$497 down · $97/month after launch · 12-month minimum
- Professional HVAC website included
- Smart Estimator Form included
- Your choice of conversion tool: Energy Savings Estimator or Replace-or-Repair Calculator
- Hosting, SSL, and security included
- 2 content updates per month
- Email support, 1 business day response
- Monthly uptime and security report
- Website stays live, maintained, and secure
- Month-to-month after the first 12 months
- You own your domain — always
$497 down · $197/month after launch · 12-month minimum
- Everything in Managed
- Revenue Recovery Engine — included New
- Both conversion tools included — Energy Savings + Replace-or-Repair
- Online booking calendar set up for you — homeowners book jobs 24/7
- Google Business Profile management
- Monthly review request automation
- Quarterly content refresh and updates
- Monthly performance reporting
- Priority support and response time
- First call on new features and add-ons
Satisfaction guarantee: deposit refunded if you don’t love the first design review. Save 2 months by paying annually after day 90.
Limited HVAC website builds each month.
Because each LeadGrid setup is done-for-you, Wrench Grid only takes a limited number of HVAC companies per month. This protects quality, setup speed, and follow-up accuracy.

“Built for Patrick first. Now built for small trade owners like him.”
A real person behind the website build.
Wrench Grid started after Kevin tried to help his brother Patrick, a New York plumbing owner, understand why money was slipping through the business even though the phone was ringing and the crew was working.
That same practical thinking now powers HVAC LeadGrid: build the contractor a credible website first, capture the calls and quote requests, then add diagnostics, reviews, follow-up, and automation as the business grows.
Until real customer reviews exist, proof comes from transparency.
Wrench Grid is still in the early client-building stage. Instead of inventing testimonials, the homepage shows what prospects can verify today: working demo sites, clear pricing, a refund point at first design review, and the founder story.
- Review the three live HVAC demo websites before you book.
- Compare the $497 start against $5K–$15K agency builds.
- See the real About page and LinkedIn profile before trusting the offer.
- Use the AI Revenue Leak Report if you want to diagnose the business first.
No fake reviews. No borrowed logos. No inflated case studies. Verified client proof will be added only after real customers launch.
Common questions before getting your HVAC website built.
What’s the difference between Owned, Managed, and Growth?
Why is there a 12-month minimum on Managed and Growth?
Can I save money by paying annually?
How long does the build take?
Is the deposit refundable?
What happens if my payment fails?
Do I own my domain?
Can I switch plans later?
What about leads and marketing?
Let’s talk about your HVAC website.
Questions about plans, timing, or what’s included? Send a message or call directly. No call centers, no runaround — when you reach out, you’re talking to the team that will actually build and maintain your site.
Hours: Monday–Friday 8:00 AM – 6:00 PM ET · Saturday 9:00 AM – 1:00 PM ET
Send us a message
Tell us a bit about your business and we’ll get right back to you.
We respond within one business day. No spam, ever.
Message sent!
Thanks for reaching out — we’ll get back to you within one business day.
One more step — skip the email tag.
Grab a time on the calendar right now and your strategy call is locked in.
Taking you to the calendar in 6… No thanks, I’ll wait for the email
Every week without a system is money left on the table.
In 7 days, Wrench Grid installs The Grid: a professional website with a smart estimator, lead nurture, estimate follow-up, and 24/7 booking working behind it. Pick Owned ($1,497 total), Managed ($97/mo), or Growth ($197/mo). $497 deposit gets us started — refundable at first design review.
See how much revenue could be slipping away.
Run your real numbers. No credit card — see the estimate first.
Free estimate — no credit card.
Calculating your opportunity
Your Website Could Recover
Those jobs are likely going somewhere — often to the HVAC company that is easier to find, trust, and contact.
Pick Your Website Plan
Choose your plan first. Today you only pay the $497 deposit. After onboarding, we’ll apply the correct follow-up billing for the plan you selected.
Owned
$1,000 due in 30 days. You own the website and files.
- Professional HVAC website
- Smart Estimator Form
- Basic local SEO setup
- 30 days post-launch support
Managed
Then $97/month for 12 months. Hosting, SSL, security, and support included.
- Everything in the website build
- Hosting + SSL
- Monthly updates
- Support included
Growth
Then $197/month for 12 months. Adds reviews, reporting, content refreshes, and recovery tools.
- Everything in Managed
- Review automation
- Monthly reporting
- Revenue Recovery Engine
Secure checkout: All plans start with the same $497 deposit today. Your selected plan is saved before Stripe checkout so Wrench Grid can apply the correct follow-up billing after onboarding.
Scrollable live preview · Like this website? Wrench Grid can build yours in 7 days — from $497 to start.
[wrenchgrid_ai_advisor]